Graphs of Polynomial Functions – Practice and Tutorial
- Posted by Brian Stocker
- Date July 2, 2020
- Comments 1 comment
Quick Tutorial
A polynomial is an expression of more than two algebraic terms, especially the sum of several terms that contain different powers of the same variable(s). Or, an equation with many terms, usually comprised of powers and a constant
Graphing a Polynomial
Write the polynomial in standard form (highest power first). Create an input-output table to determine points. Plot the points and connect the dots to draw the graph.
Ex. Graph the given equation.
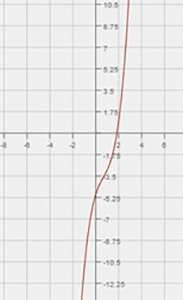
y = x3 – 2x2 + 3x – 5
Noticing the highest degree is 3, we know that the general form of the graph should be a sideways “S.”
Here is the input – output table
-
If the degree of the polynomial is even and the leading coefficient is positive, both ends of the graph point up.
-
If the degree is even and the leading coefficient is negative, both ends of the graph point down.
-
If the degree is odd and the leading coefficient is positive, the left side of the graph points down and the right side points up.
-
If the degree is odd and the leading coefficient is negative, the left side of the graph points up and the right side points down.
Graphing Polynomial Practice Questions
1. Describe the end behavior for the function f(x) = – 2x5 + 3x + 97.
a. Up on the left and right.
b. Down on the left and right.
c. Down on the left, up on the right.
d. Up on the left, down on the right.
2. Describe the end behavior of the polynomial P(x) = (2x – 5)(3 – x)(4x2 + 7).
a. y → 0 as x → -∞ and y → -∞ as x → ∞
b. y → -∞ as x → -∞ and y → ∞ as x → ∞
c. y → -∞ as x → -∞ and y → -∞ as x → ∞
d. y → -∞ as x → -∞ and y → 0 as x → ∞
3. Determine the x-coordinate of the graph for the polynomial: y = x2 + 2x – 1
a. 1
b. -1
c. 1/2
d. -1/2
4. What happens to the graph when the original equation y = x2 – x – 2 is changed to y = 2x2 – x – 2 ?
a. The graph shifts up, but the shape remains the same
b. The graph shifts down, but the shape remains the same
c. The graph becomes more narrow (compressed)
d. The graph becomes more wide (stretched)
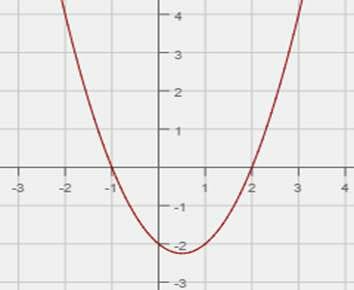
5. Which equation fits the graph shown?
a. y = x2 + x – 2
b. y = x2 – x – 2
c. y = 2x2 – x – 2
d. y = 2x2 + x – 2
6. What value can x NOT have, in the polynomial: y = x2 – x – 1
a. 0
b. 1
c. 2
d. x can be any real number
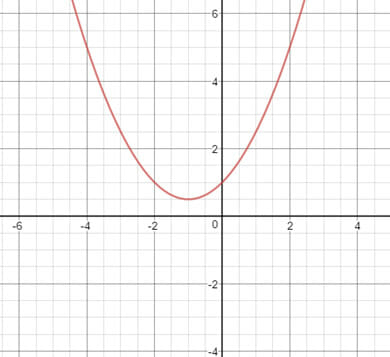
7. Which equation fits the graph shown?
a. y = (1/2)x2 – x + 1
b. y = (1/2)x2 + x + 1
c. y = (1/2)x2 + x – 1
d. y = (1/2)x2 – x – 1
8. What happens to the graph when the original equation y = x2 – 2 is changed to y = -x2 – 2 ?
a. The new graph shifts down, but the shape remains the same
b. The new graph shifts down, and the shape changes
c. The new graph flips (opens down), but the shape changes
d. The new graph flips (opens down), but the shape remains the same
9. What is the maximum or minimum for the equation: y = 2x2 + 2x – 2 ?
a. Minimum at (-0.5, -2.5)
b. Minimum at (0, -2)
c. Maximum at (-0.5, -2.5)
d. Maximum at (0, -2)
10. Describe the general shape of the graph found by the equation: y = x4 – x2 .
a. A curved “W”
b. A curved “M”
c. A curved “S”
d. A parabola
Try a FREE Algebra Quiz
Algebra Problem Answer Key
Answer Key
1. D
Drawing the graph of a 5th degree polynomial is not a practical way to solve this problem. Instead; we need to remember some properties of polynomial graphs:
Notice that this is an odd degree polynomial. So; two ends of the graph head off in opposite directions. If the leading term is positive; the left end would be down and the right end would be up. However, the leading term here is -2x5 that is negative. So; the end behavior for this function is up on the left and down on the right.
2. C
The end behavior of a polynomial is determined by the degree of the polynomial and the sign of the leading term. We do not need to expand the polynomial; by multiplying the x values in three parenthesis, it is easy to see that the leading term is – 8x4. Then, the degree of the polynomial is 4 and the leading term is negative. This means that its graph is downwards with end points ® – ¥. Even degree means that both left and right end points have the same characteristics; y → -∞ both as x → -∞ and x → ∞.
3. B
The x-coordinate of the vertex is found by (-b)/(2a) = (-2)/(2 * 1) = -2/2 = -1
4. C
The leading coefficient of 2 makes the curve more “steep”, giving the effect of compressing the sides of the parabola together.
5. B
The points (-1,0), (0,-2), and (2,0) are on the graph. Substituting the x-coordinates into the equations, only “y = x2 – x – 2″ gives the correct corresponding y-coordinates.
6. D
All real numbers are valid for x.
7. B
The point (0,1) is on the graph and fits both A and B. However, the vertex is at (-1, 1/2) and works with B but does not work for A.
8. D
The negative with the x2 term makes the parabola open down, showing a reflection across the horizontal line (y = -2).
9. A
The vertex identifies the vertical boundary for a parabola. The x-coordinate is found by (-b)/(2a) = (-2)/(2 * 2) = (-2/4) = -1/2. Substituting into the equation gives a y-coordinate (-2.5). Because the leading coefficient is positive, the parabola opens up, so the vertex is a minimum.
10. A
Select x-coordinates of -1, -1/2, 0, 1/2, 1 and substitute into the equation gives points of (-1, 0), (-1/2, -0.19), (0, 0), (1/2, -0.19), and (1, 0), creating a curved “W”.
Date Published: Thursday, July 2nd, 2020
Date Modified: Thursday, April 18th, 2024
Created by Brian Stocker and the team in Victoria, BC.
Helping students succeed since 2005
Got a Question? Email me anytime - Brian@test-preparation.ca
You may also like
Police Problem Solving for SSPO and OACP Test
Police Problem Solving: Rule Application (Deductive Logic) This section of the SSPO (Sigma Survey for Police Officers) and OACP certificate process measures your ability to apply a general rule or a policy to a specific real-world situation or scenario. This …
Toolbox Math – Basic Math for Trades
Basic Math Practice Questions for Canadian Trades Trades Entrance Canada Trades Alberta Trades Skilled Trades Readiness
CELPIP Writing Prompts
The CELPIP writing evaluates your ability to communicate effectively in written English different tasks. Here are some sample CELPIP Writing prompts for writing an exmail. You are given a prompt and a scenario. Your email may be formal or informal, …


1 Comment
Can you enlarge some of the graphs?